
How do power enterprises create diversified data visualization scenarios?
Not only technology but also thinking should be revolutionized to change IT-driven into business-driven which is enabled to lead data application scenarios.
Power Industry
After years of development, the power enterprises, as the nation’s core and key enterprises, have set up comparatively perfect basic information system such as CRM, ERP, MRP, OA, etc., from headquarter to subordinate units, which are used to guide their daily business operation and management. However, it is not enough to practically and centrally show, analyze and apply data visualization, and the existing data application tools are too much limited to feasibly speed up enterprise operation and management.
1、Due to limitations of IT system, users feel difficult to play their autonomy.
Whose demand for independent self-service data analysis and application exploration becomes increasingly stronger, users wish to develop, display and prepare reports, and design the business scenario for data analysis autonomously and independently, but the original data analysis system, difficult to operate, with backward function and requiring for higher learning cost, fails to satisfy diversified business analysis scenario.
2. Severe situation of data islands
The original financial informatization system, MRP system, ERP system,etc.are relatively independent, and there is not uniform platform for data association, integration and linkage among the internal information systems, therefore, it is impossible to review the general picture of overall enterprise business from a unified point of view and difficult to completely release the true value of data.
3. Lack of data management mechanism and guarantee
Enterprises have accumulated a certain amount of historical data, however resulting from lack of initial planning for data management mechanism, data quality is uneven, basic data are disperse,separate and inconsistent, which is difficult to provide support for statistical analysis and application of data at the upper layer.
4. Due to the sole and simple data analysis method and lack of interactive analysis, failure to perfectly match business scenario analysis requirements.
At present, the analysis report provided by power enterprises, which is in a simple and hidebound form and has poor timeliness of response to analysis demand, fails to offer data analysis function interactive with the business personnel, therefore, users demand for fast and flexible data analysis cannot be met. At the same time, in the aspect of data visualization display, due to the poor graphics with a simple content unpleasing to the eye, users cannot be facilitated to explore and analyze on the basis of "what they see".
5. Due to long project cycle, too much manpower and material resources need to be invested.
The traditional big data platform requires high project cost and has slow effect and high risk, due to the long construction period,thus it needs more manpower and material resources to support for implementing the project. Hence the power enterprises require data analysis platform that has short cycle and is convenient and easy to operate, in order to shorten the construction period and reduce input of manpower and material resources on the one hand, on the other hand, quickly output construction achievements and fast set up data analysis business scenarios;
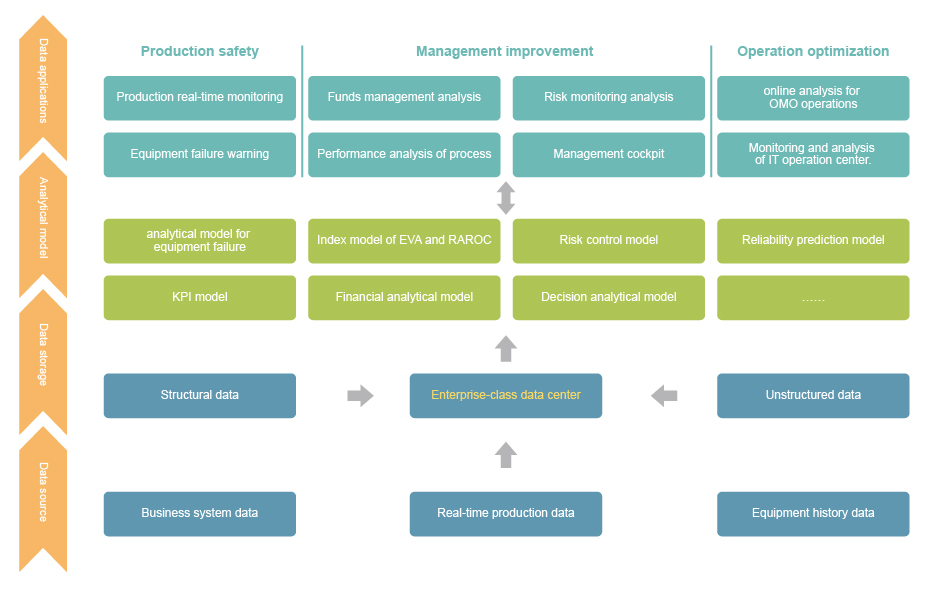
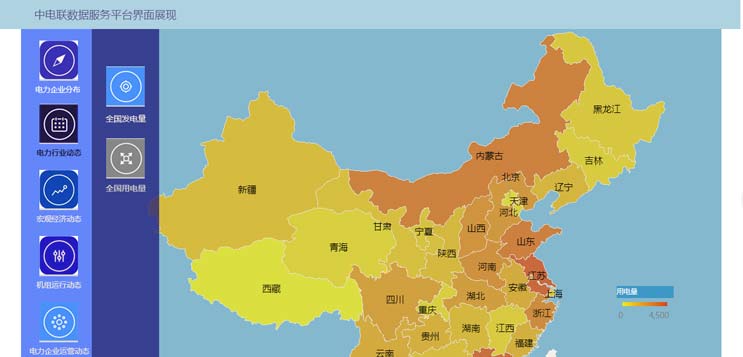
Basing on the platform constructed for enterprise-class one-stop big data application, we have centralized and integrated data of multiple independent systems, and strengthened management of enterprise data assets, so as to break the data island. Employees at different levels use self-service data visualization analysis technology to explore data values, quickly build data application applicable to business scenarios, realize real-time monitoring during production, online analysis of OMO operation, equipment fault early warning, funds management analysis, end-to-end performance analysis and other data applications required by different business modules.
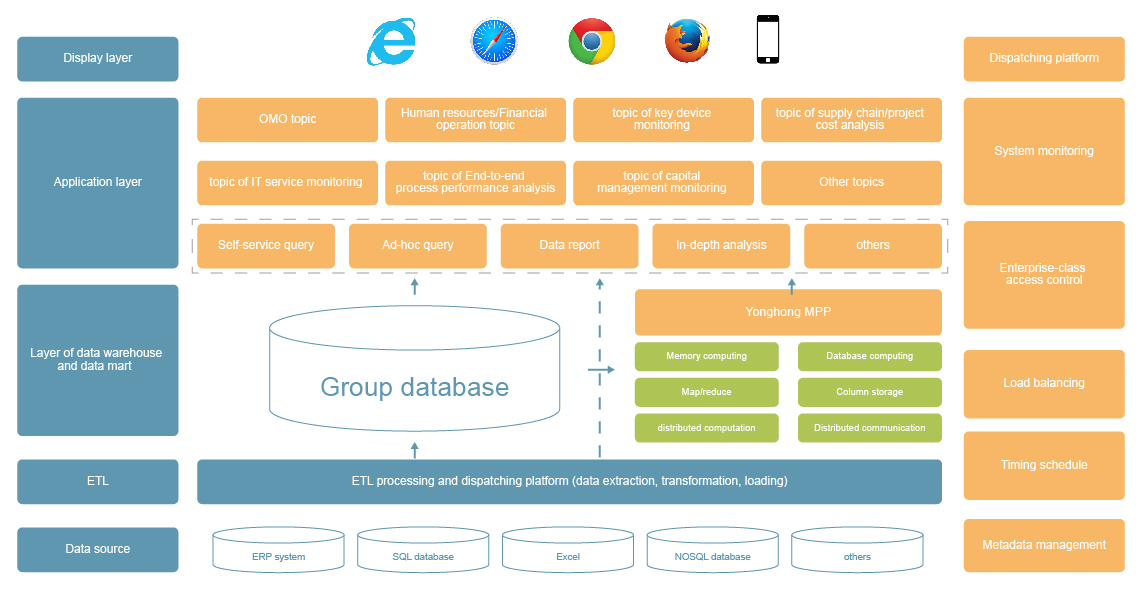
MPP architecture diagram
The technical architecture of the whole platform includes five layers as follows:
1. Data source layer: to connect the data from different business information system, realize correlative integration of heterogeneous data sources, centralize management on data, and build a solid data foundation.
2.ETL layer: to define unified data API standard interface, and clean, transform and load data; particularly,de-noise data to improve its accuracy and validity.
3. Layer of warehouse and mart: to store detailed and specific data after ETL in the data warehouse by a model in shape of star or snowflake, and input permanent MPP Yonghong data mart after sorting topics of data model to accelerate processing of operation according to demand by different business analysis topics of the power industry.
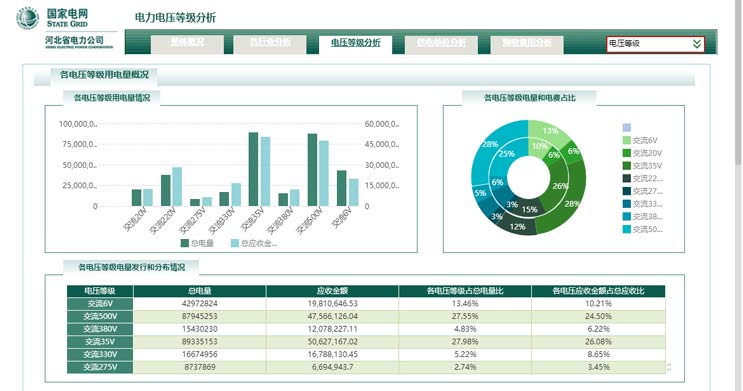
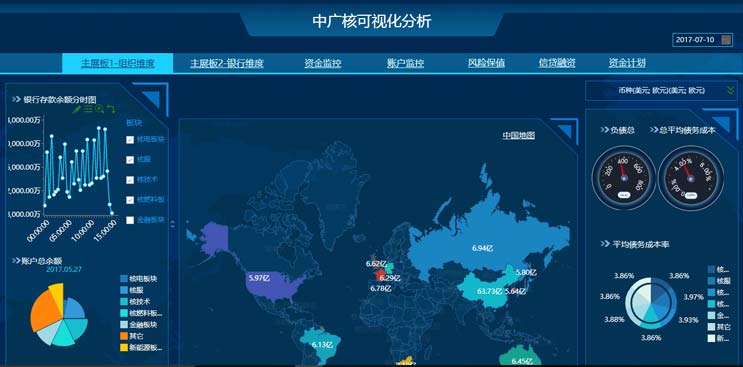
4. Application layer: to set up rich data application scenarios, such as ad-hoc query, multi-dimensional analysis, data report and in-depth analysis, etc.,as required by business personnel at different levels and analysis topics.
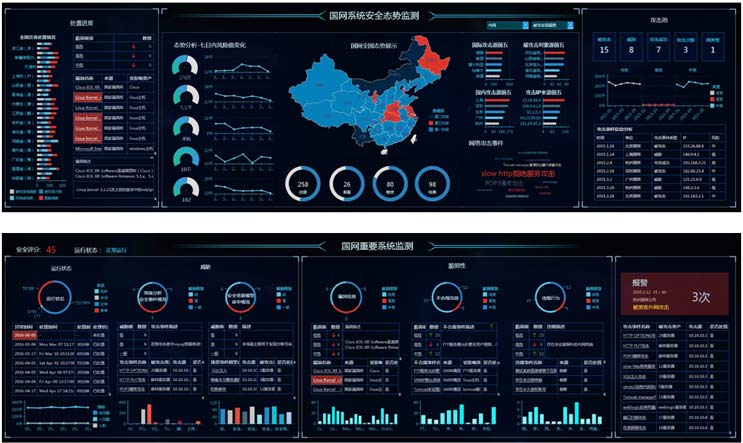
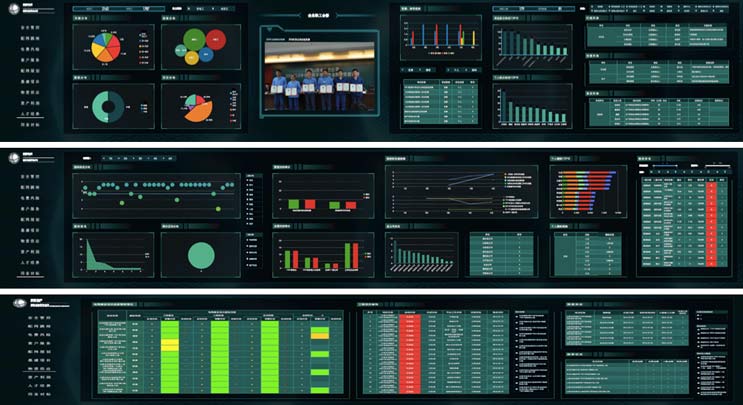
5. Display layer: in a display method of rich and beautiful charts, flexible way of interaction, the analysis results are presented to decision-making level, management, IT staffs and business users, therefore, all users can access the system through the major browsers or mobile terminals.
1. Definition of strategic goals
Strategic goals may be ambitious or not, and departments or working groups have their own targets as well. Then, from the point of view to implement and practise big data project, requirement is the most important, and data applications cannot be properly managed without analysis and abstraction of the target.
2. Build data analysis index system
Analysis indicators, as the lubricating oil flowing through the overall digital operation system from beginning to the end and a connector between business and original data, result from the original data after processed and in turn drive other data application products. Enterprises have to sort business analysis indexes, establish a set of standard index system of data analysis, clearly define caliber and meanings of indicators,and standardize management on indexes,so as to guarantee consistent data statistics caliber and accurate results.
3. Set up data analysis and application
Construct a set of standardized, intelligent and movable center of data classification and application in stages and offer corresponding data application service to staff at different levels within enterprise,so as to provide corporate executives with digital decision support and risk monitoring while meeting the demand of data analysts for daily statistics and analysis, and concise statement and indicators to help managers to gradually change data processing to data analysis.
4. Implementation and practice of data project
Construction for implementation and practice of big data projects, instead of large and allinclusive, should continue step by step and gradually release the data value in the process to carry out the project. For the enterprises, they may set up a grand blueprint for the big data application in the coming next few years,but they have to gradually and rapidly decompose it in the implementation process. For the enterprise administrators in charge of big data projects, risk management and control over big data projects are also very necessary.
1. The one-stop platform for big data application construction greatly reduces the threshold of data application construction, thus, the construction data application is no longer untouchable. Along with the realization of business and management value, a good snowballing cycle is formed to truly play a greatly valuable role that the data bring to enterprises.
2. It promotes application of big data analysis technology within enterprises, helps them to improve accuracy and timeliness of data, innovation of management and operation and their decision-making level, realizes online monitoring and panoramic display for main business activities and core resources of the company, and grasps enterprise operating conditions in all aspects.
3. It helps power enterprises to build data application system, estimate characteristics and requirements of various analysis topics and quickly construct analytical model, so as to truly realize data-driven decision-making. Through the data operation, the data analysis results at different levels are transformed into operation management and strategy, so as to truly release the data value and build corporate core competitiveness.