
How to solve the challenges brought by massive data in the Internet industry
The visual presentation of high-performance data analysis is the necessary data analysis platform of the Internet.
Solutions for Internet Industry
Along with web-scale development, there are 632 million net citizens in China, the Internet penetration rate is 46.9%, substitution from feature phones to smart phones has been basically completed, smart phone users has formed a large scale, and data of internet industry increasingly bursts. Internet industry products and services involved in various industries include web portal, e-commerce, instant messaging, search engines, telecommunications value-added, online games, video media, travel, Internet finance, online education, online recruitment, social network and so on. And the value behind such mass data can help internet enterprises to master intention of the market and users, for innovative change and leading development in time. The data value needs to be solved through big data technology, and the Internet industry is the pioneer of big data technology.
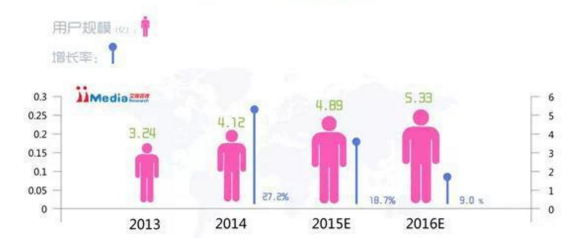
Internet involves the popularity of mobile users, i.e., all users' online behaviors generate series of big data, including data of users’ behaviors such as user access, browse, purchase, transportation, consumer preferences.
How to gather the current business situation of all stores for real-time monitoring and warning, and which products sell well? Who will be your customer among so many mobile users ? Which type of sales promotion can impress them most? How to attract more users to pay? How to make an analysis for users’ portraits?
Daily-increasing data are basically at several decades T level expected to reach a hundred T level soon, which requires higher data collection and processing capability. How to complete data collection and processing within the effective time is a difficult problem that must be solved.
System construction and data processing in the type of chimney resulting in different data statistical caliber (algorithm, rules), meanwhile disperse and split data management, serious information island, difficult data correlation requires more resources to compare and analyze the statistical data at single standard and provide uniform data to support the application of statistical analysis.
There are so many application vendors at upper layer with more complex demand, therefore, how to allocate resources, how to share data and how to control and mostly meet application requirements with flexibility and extensibility at the same time are the key problem to realize data sharing and exert the platform value.
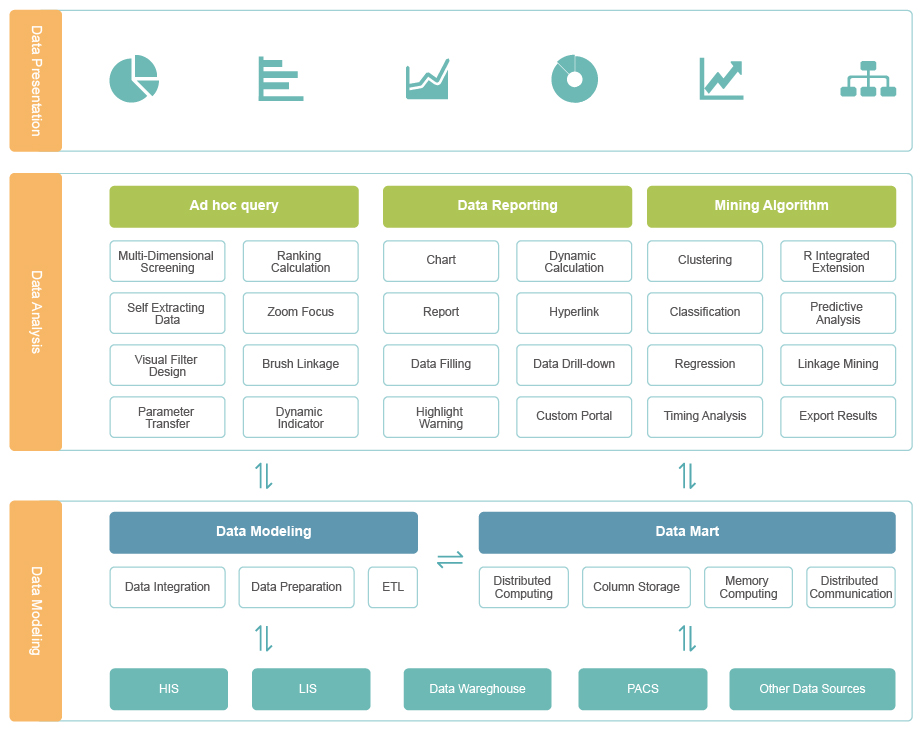
Overall Architecture Diagram
The whole system covers three levels.
1. Data layer: integrate different business information systems, and insight the data from an overall perspective.
2. Modeling layer: set up different analysis topics for different analytical perspectives.
3. Display layer: in rich and beautiful charts, by flexible way of interaction, the analysis results are presented to decision-making level and business users, and IT and business departments can make different displays on the basis of their own needs.
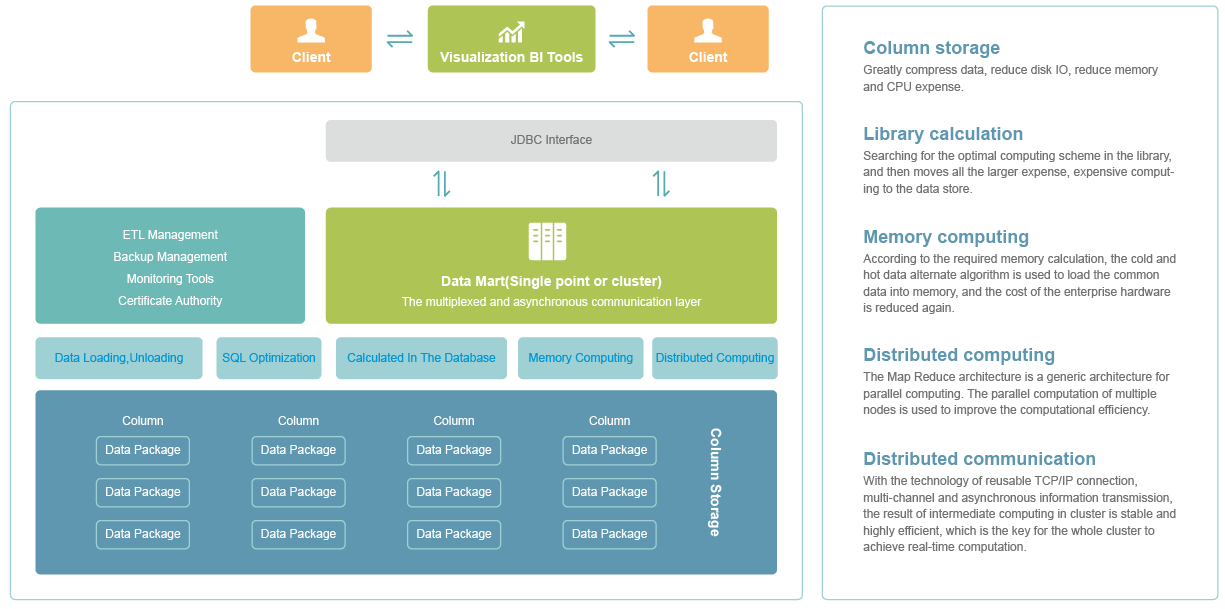
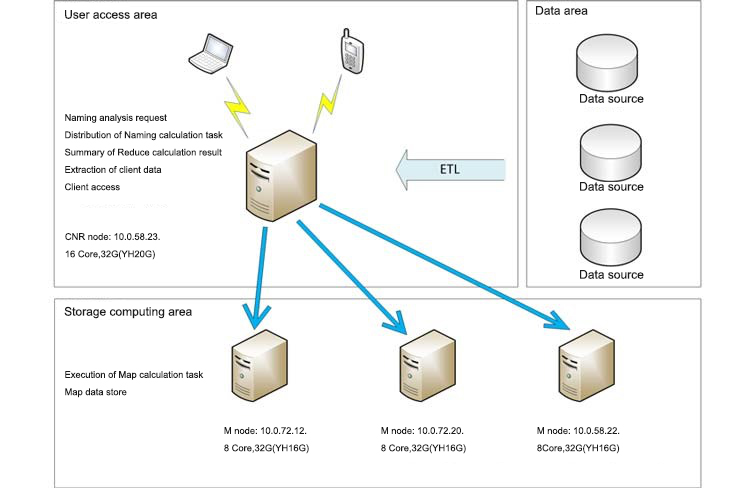
MPP Architecture Diagram
The highly-performed MPP data mart of Yonghong is used as medium. MPP distributed data marts support high concurrency and high availability, each of which helps to well prepare detail data for light modeling on the basis of a topic, and the data are distributively stored on each node and well backed up at the same time. The data is efficiently compressed according to the way of column storage, labeled and stored on disk. When query computation required, the memory calculation is used to calculate data, and each robot node will calculate at the same time, and the result will be presented at the application layer.
1. The visualization analysis platform of Yonghong big data can improve the operation and analysis ability of enterprises, effectively enhance customer satisfaction and promote sustainable and healthy development of enterprises.
2. Reduce cost and expense, unify the data sharing mode and centralize the control and operation of the platform. It greatly reduces the redundant storage, repetitive processing of data as well as management resource consumption, which greatly reduces the unit cost of data; the attributes of agile self-service products contribute to significant result improvement of business analysis and IT input.
3. Agile edition of data report, flexible data analysis and beautiful visual presentation fully meet all requirements for fast analysis.
4. Efficient big data processing ability helps users to confidently deal with massive historical data and rapidly growing incremental data, and a second response to the calculation and display of data at the level of ten billion can be achieved.
5. It helps users to easily integrate depth analysis algorithm and understand data more clearly so as to explore the value of data.